ACTIVITY-BASED COSTING
See what customers, products and services really cost
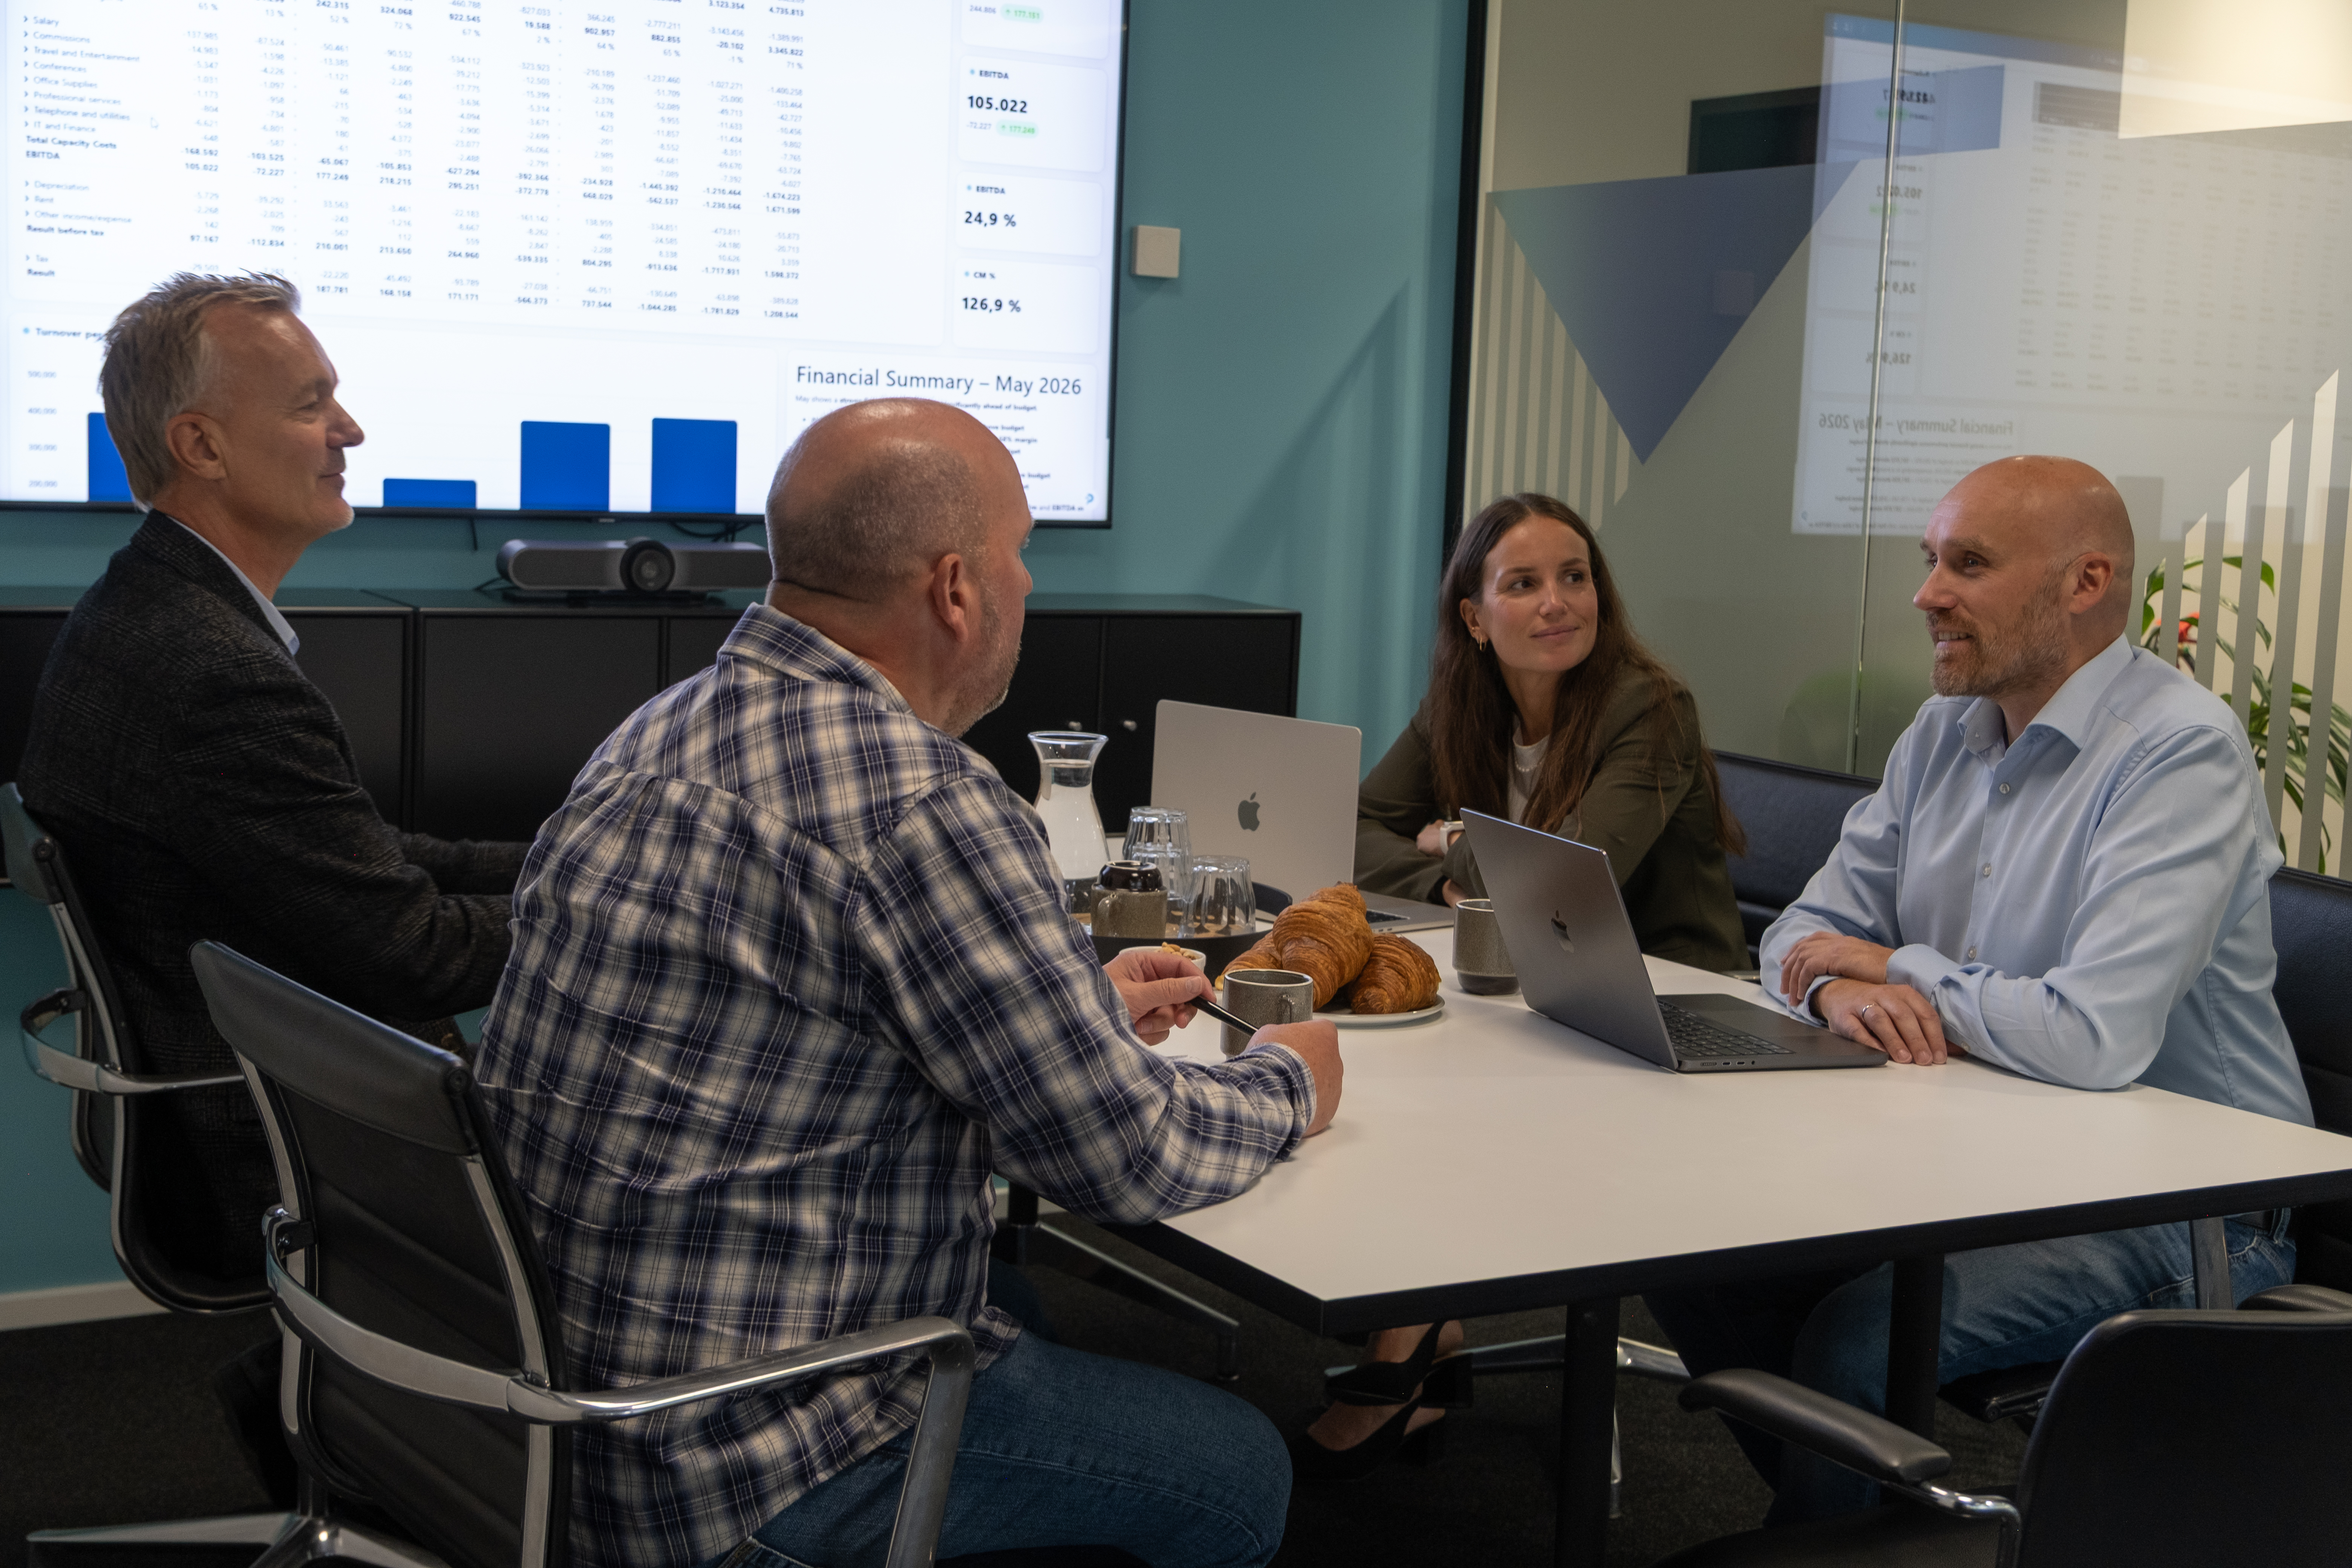
Revenue and gross margin do not always tell the full story. Activity-Based Costing in PLANNORS allocates indirect costs based on the activities and drivers that create them, giving Finance a more accurate view of resource consumption, cost to serve and profitability.
Use insights into the true cost drivers to support decisions on pricing, customers, products, services and prioritisation.
Same revenue. Very different profitability.
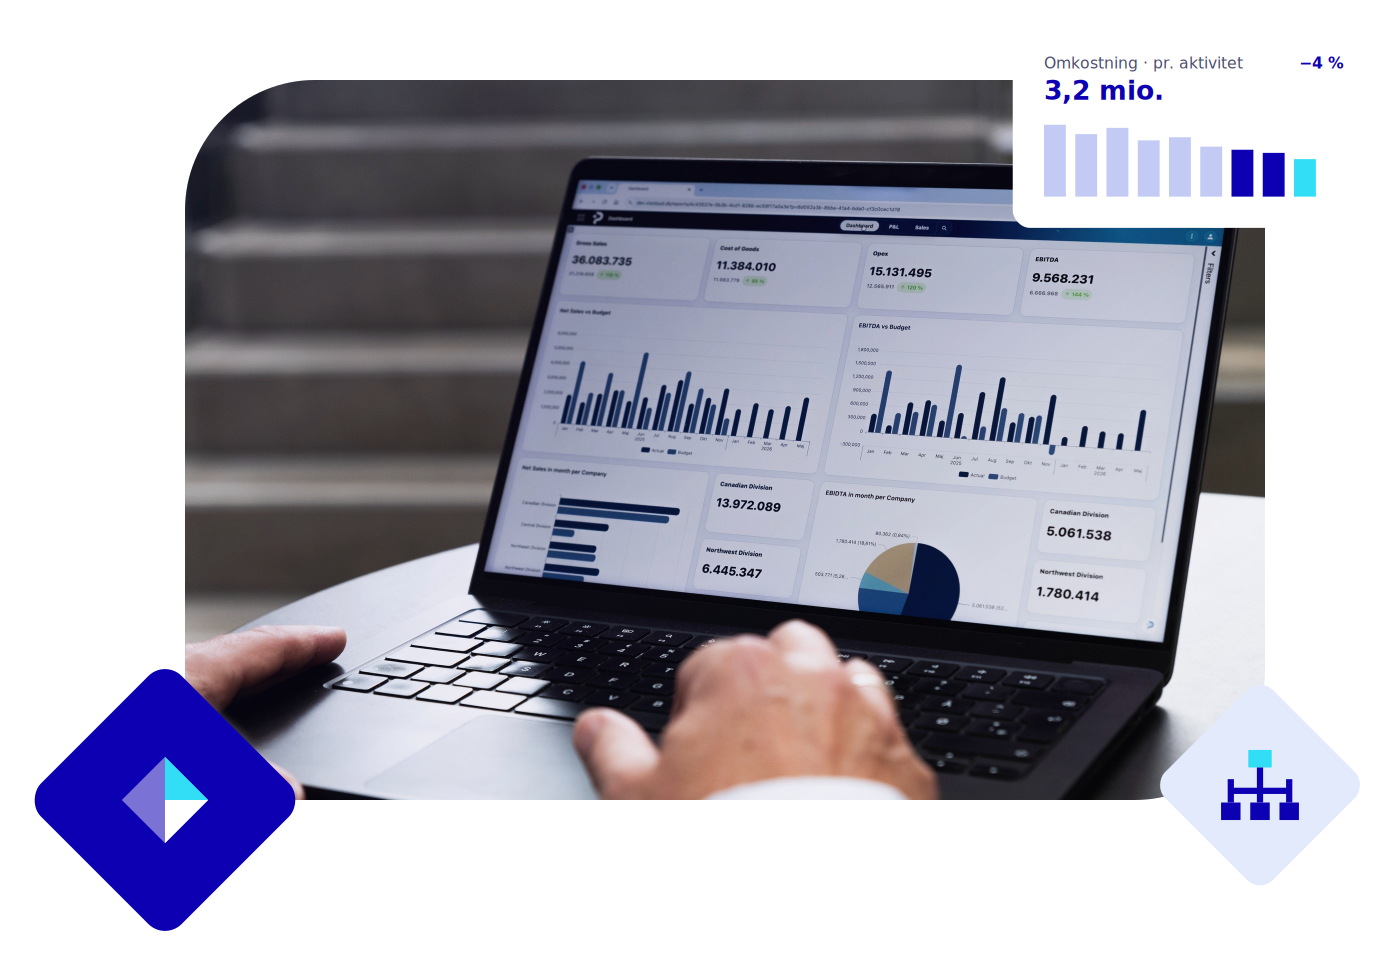
Two customers can generate the same revenue and still be very different businesses. One may require far more sales time, administration, delivery and support than the other. With Activity-Based Costing, you can allocate indirect costs based on actual resource consumption and gain a more nuanced view of what customers, products and services contribute.
WHEN AVERAGES DO NOT TELL THE FULL STORY
Averages hide where the money is being spent
Many companies have a strong handle on revenue, gross margin and total costs. However, it can be far more difficult to see which customers, products, services and activities are actually consuming resources in the organisation.
When indirect costs are allocated using broad allocation keys, differences in resource consumption can disappear into the average. For example, a high-revenue customer may require substantially more sales, delivery, support and administration than another—without it becoming clear in traditional profitability analysis.
This makes it harder to see where the business truly makes its money—and where resources are being used without a corresponding return.
FROM RESOURCES TO PROFITABILITY
From cost to activity—and on to customer and product
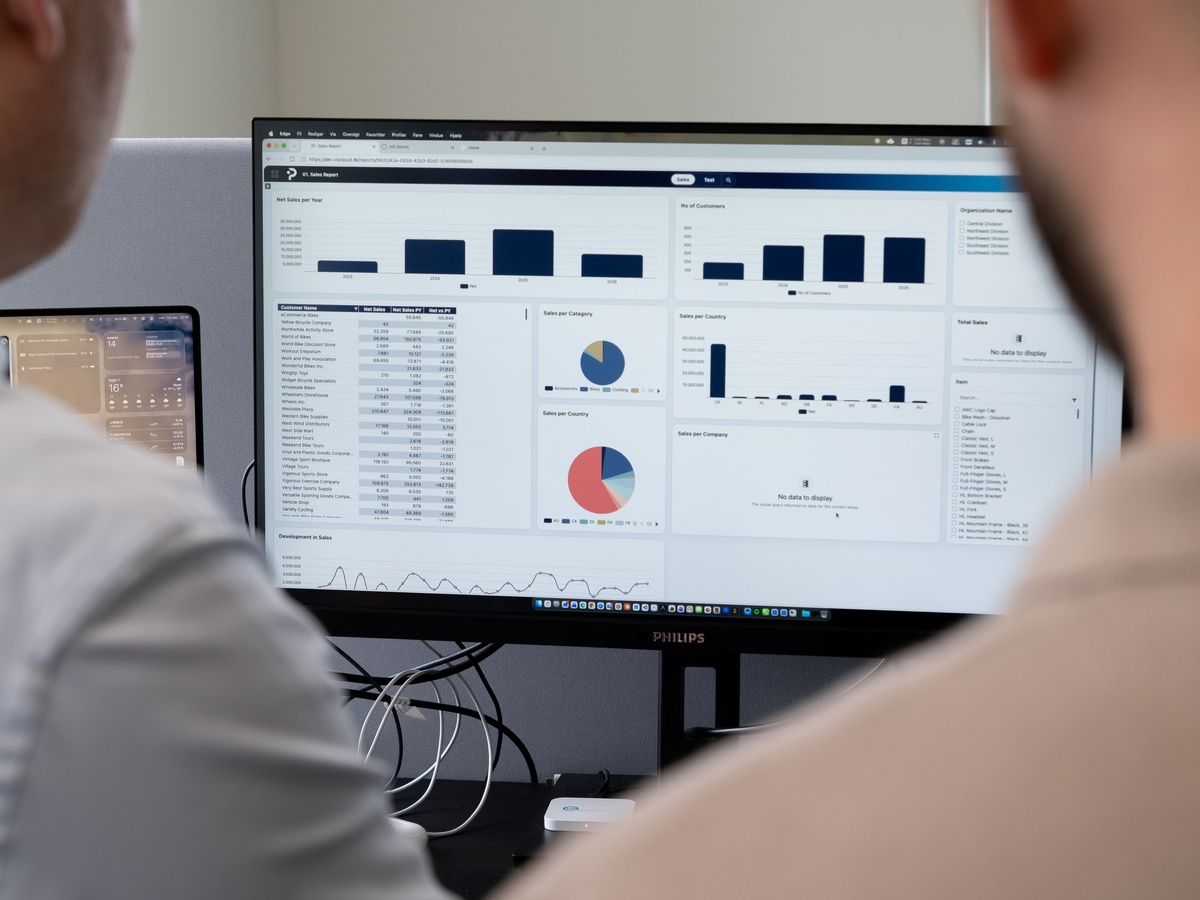
Activity-Based Costing in PLANNORS creates a link between the resources the business uses, the activities those resources support, and the customers, products and services that draw on those activities.
By working with relevant cost drivers, indirect costs can be allocated based on resource consumption rather than broad averages. This enables Finance to analyse cost to serve, margins and profitability on a more nuanced basis—and understand what drives the cost, where it arises, and what it is ultimately used for.
ACTIVITY-BASED COSTING IN PLANNORS
From cost to explanation
Finance can model the relationship between resources, activities, drivers and cost objects, thereby creating a more detailed basis for understanding profitability.

Allocate indirect costs based on actual consumption
Allocate indirect costs based on activities, drivers and resource consumption rather than broad averages and generic allocation keys.

See which activities consume resources
Link costs to the processes, services and workflows that create them, and gain insight into where the organisation’s resources are being used.

Analyse profitability by customer, product and service
See where the margin holds—and where products, customers or services require more resources than the headline figures suggest.

Understand cost to serve
Analyse what it truly takes to serve different customers, channels and services—for example through handling, delivery, support and administration.

Document drivers and allocations
Create transparency around the inputs, drivers, allocation keys and allocations the ABC model is based on.

Use ABC for pricing and prioritisation
Use insights into costs and profitability as the basis for decisions on pricing, quotes, product portfolio, customer agreements and service levels.
TRADITIONAL FINANCIAL MANAGEMENT VS. ABC
How does Activity-Based Costing work?
Activity-Based Costing does not replace traditional financial management. It adds an additional perspective on what drives costs and where resources are actually used.
Traditional financial management
Finance follows accounts, departments and budgets and can see where costs sit and how they develop. This supports, among other things, financial statements, budget follow-up and reporting, but broad allocations can make it difficult to see what is actually driving indirect costs.

Activity-Based Costing
Finance follows activities, drivers and resource consumption and can therefore analyse what creates the costs and which products, customers or services draw on them. This provides a stronger basis for cost to serve, margin analysis, pricing and efficiency improvements.
FROM MODEL TO DECISION
What questions can Activity-Based Costing help answer?
Product profitability
Which products deliver healthy margins once production, warehousing, handling and support are included.

Customer profitability
Which customers require more service, more deliveries, more customisation or more administration than the figures suggest at first glance.
Cost to serve
What it truly costs to serve specific customers, channels or service agreements.
Pricing and quotes
Where Finance should adjust prices, quotes or agreements because costs do not follow the average model.

Activities that put pressure on margins
Which processes, routines or service requirements consume resources without generating corresponding revenue.

Product portfolio and channels
Which products, services or channels should be examined more closely when Finance sees the true costs behind them?
MEET PLANNORS
Built for how Finance works today
Finance must work faster, involve more people and create a stronger basis for decision-making—while ensuring that complex processes, data and governance fit together.
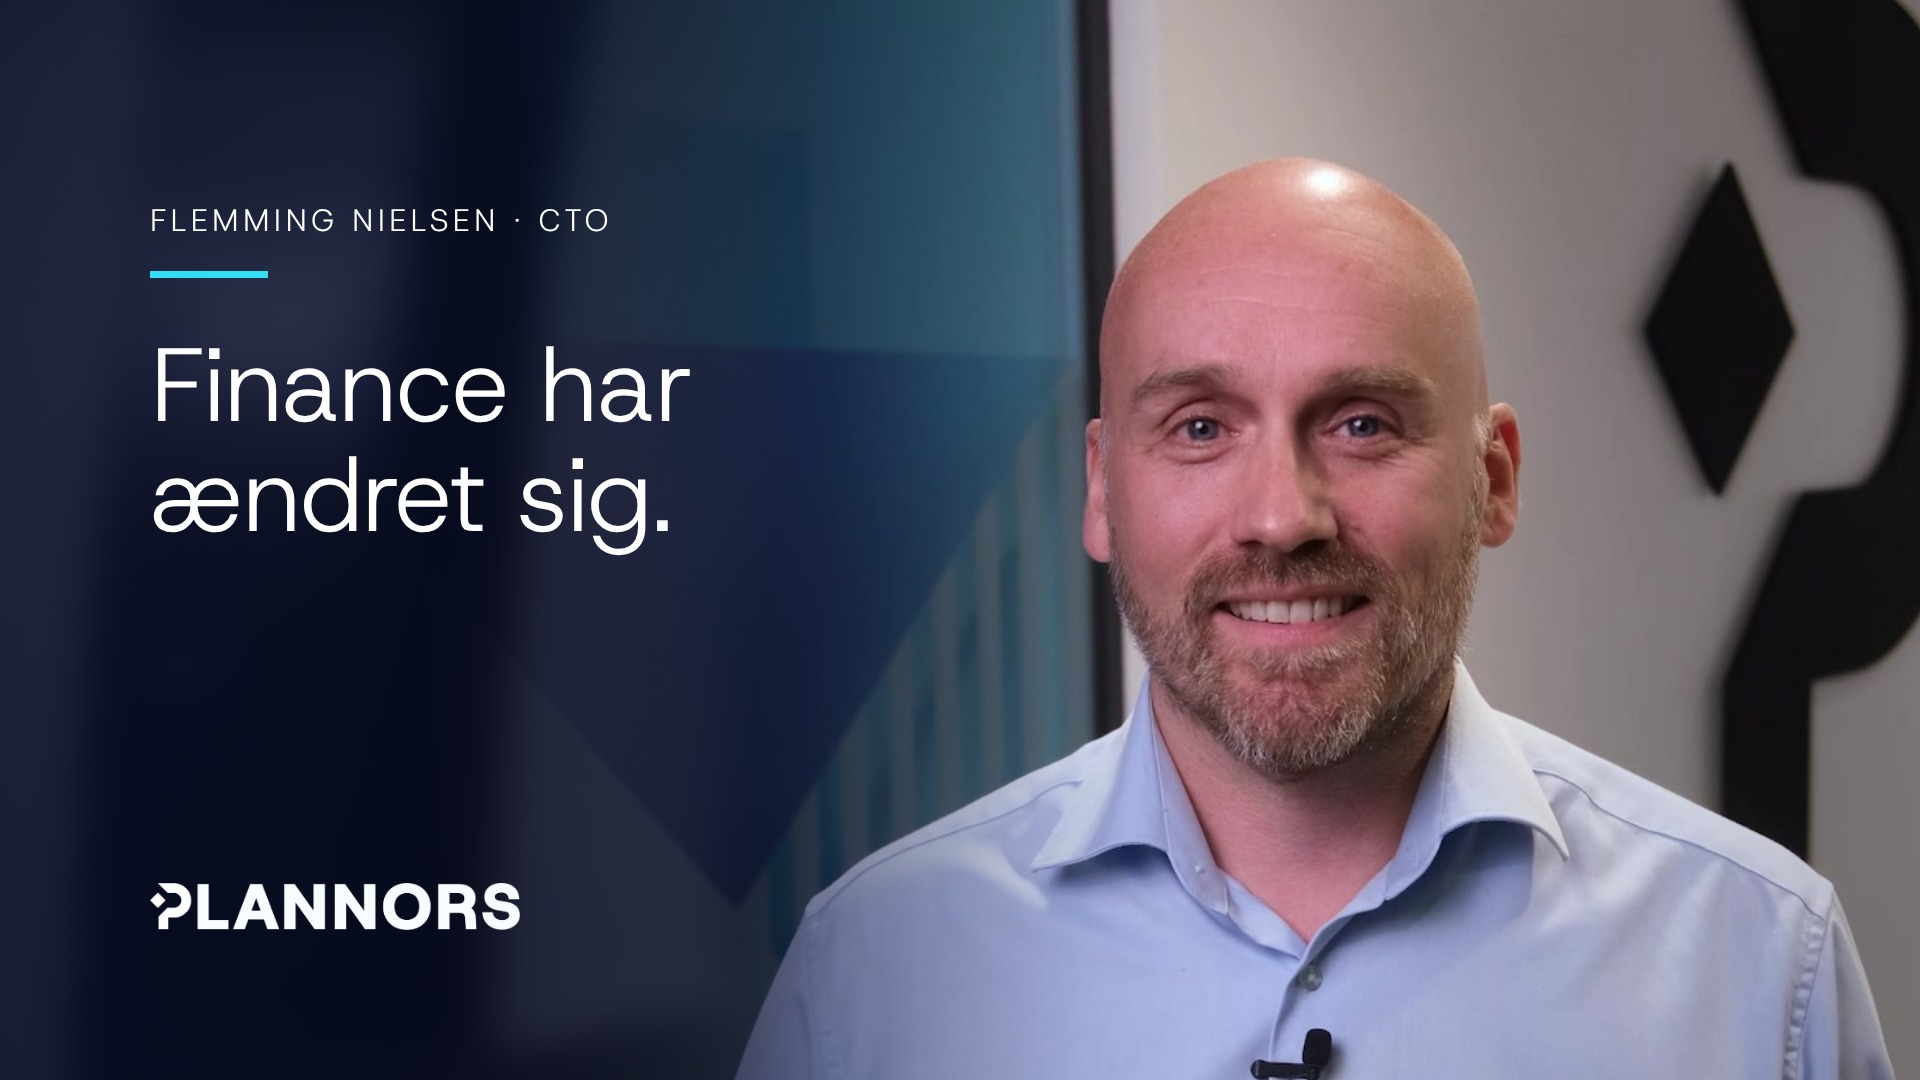
Hear our CTO, Flemming Nielsen, explain how PLANNORS brings budgeting, forecasting, consolidation and reporting together in one cloud-native Finance & Operations platform—and how AI is integrated directly into the platform, including for insights, variances and forecasting.

Customer testimonial · Kohberg
“We use VIS in many parts of the business and are very satisfied with the solution. At the same time, we see some exciting opportunities in PLANNORS, which is why we have initially chosen to move parts of our VIS solution onto the new platform.”
Mathias Gefke
Business Intelligence Manager | Kohberg

RELATED SOLUTIONS
Build on your ABC analysis

Cost budgeting
Use insights from ABC when budgeting costs.

Project finance
Track the finances of each individual project from budget to actuals.

Reporting
Report on profitability by customer, product and service line.
Next step
See what ABC could look like in your organisation
Book a demo based on your business. We will show how PLANNORS can connect resources, activities and drivers with customers, products and services—and create a more nuanced basis for profitability, pricing and prioritisation.